Many of the best astrophotography results involves capturing fifty or more images of celestial objects. However, capturing high-quality images can be challenging due to various factors such as atmospheric turbulence, light pollution, and equipment limitations. The PixInsight Subframe Selector process is specifically designed to help astrophotographers select and evaluate the quality of individual image frames (subframes) before integrating them into a final composite image.
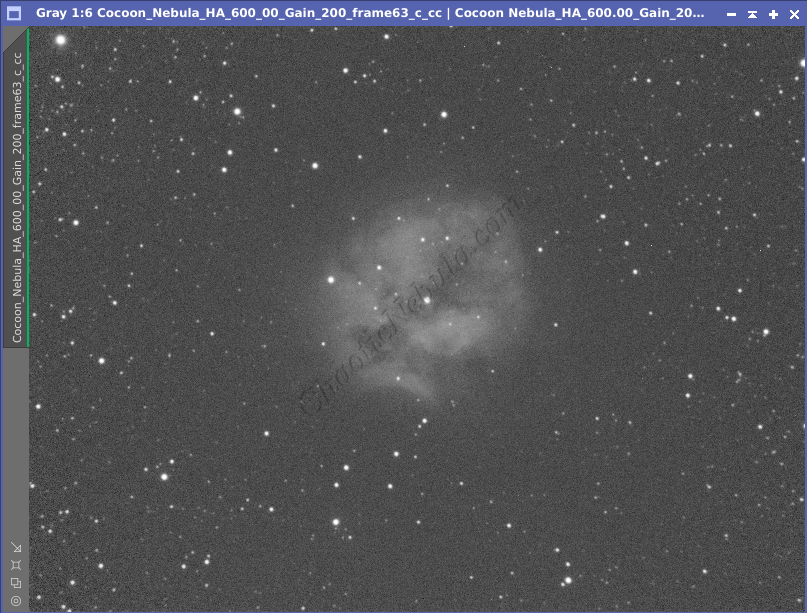
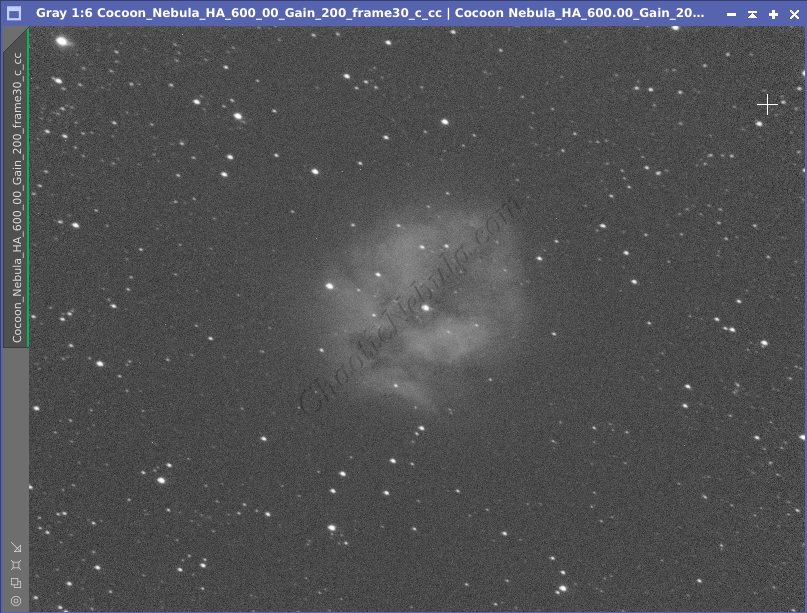
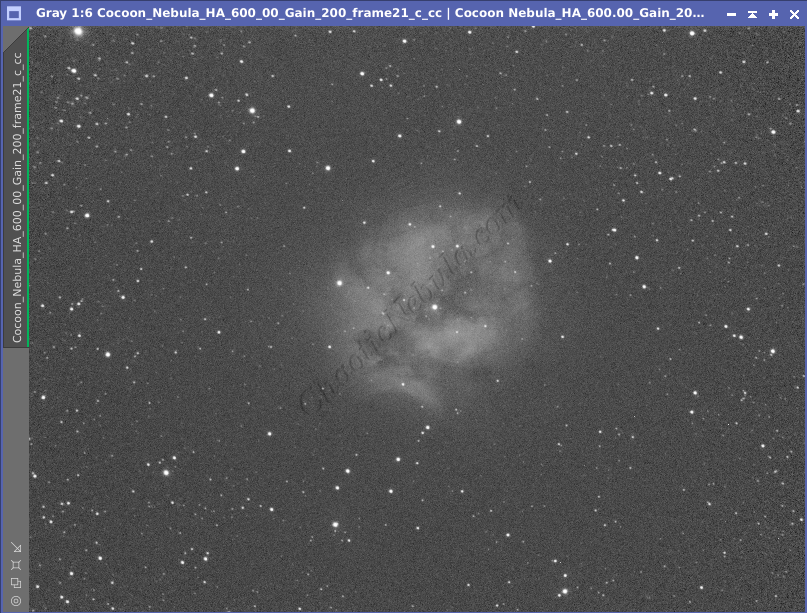
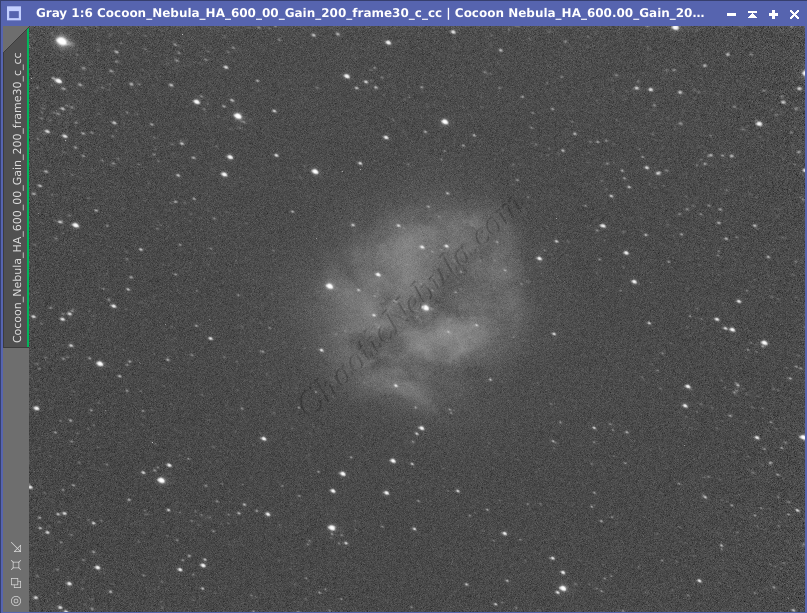
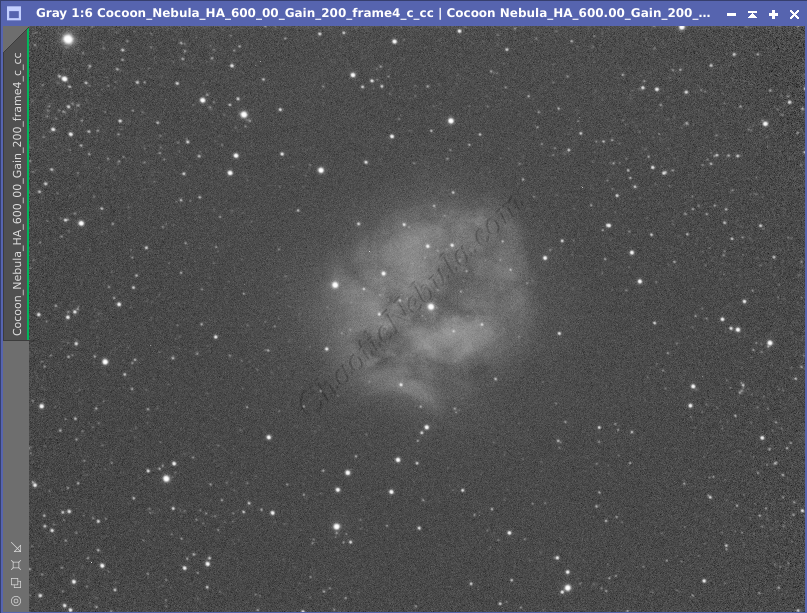
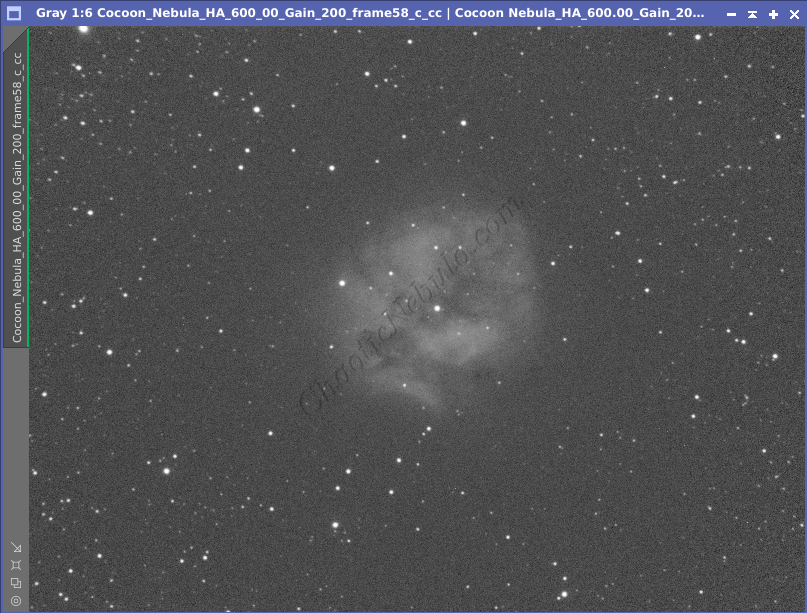
This is a crucial step because not all subframes are of equal quality, and including poor-quality frames in the final image can degrade the final image’s overall quality. Take the following images as an example. One is high quality, one is average, and a third is poor.

At a high-level, PixInsight Subframe Selector does the following:
- Image Quality Assessment: Algorithms assess the quality of each subframe based on parameters such as signal-to-noise ratio (SNR), full width at half maximum (FWHM), eccentricity, and background noise. These metrics help determine the overall quality and suitability of each subframe for integration.
- Subframe Weighting: Weights are assigned to each subframe based on the quality assessment, with higher weights given to frames of higher quality.
- Subframe Selection: The subframes are ranked and the top ones are selected for integration.
Running PixInsight Subframe Selector is a multi-phased process.
Step 1:
Prerequisites
Knowing information about the imaging system is important for accurately evaluating various image quality metrics and making informed decisions during the image integration process. The information required is as follows:
Subframe Scale and Units
The subframe scale is a combination of the focal distance and pixel size. This determines the resolution, defined as arcseconds per pixel.
To calculate arcseconds per pixel, use the following formula;
Arcseconds/Pixel = 206.2648 * ((Camera_Pixel_Size_in_μm) / (Telescope_Focal_Length_in_mm))
For example, a 12 inch (304.8mm) telescope with a focal ratio of 6.3 (focal length = 1920) using a camera with a pixel size of 3.8μm = 40.8 arcseconds per pixel.
- Subframe Scale: 40.8
- Scale Units: Arcseconds
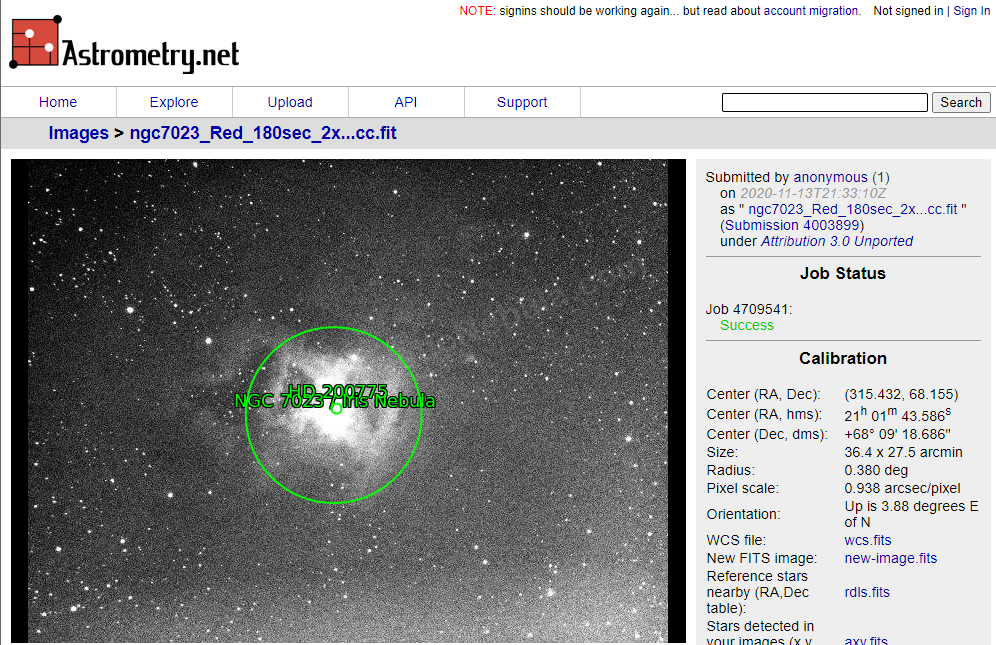
Online tools are also available that can calculate these parameters (as well as provide the image coordinates). If you upload one of the frames to Astrometry.net it provides the subframe scale in arcseconds/pizel.
Camera Gain and Data Units
Camera gain refers to the amplification factor applied to the signal read from the camera sensor before it is converted into digital values by the analog-to-digital converter (ADC). This information can often be obtained from the FITS header of one of the subframes.
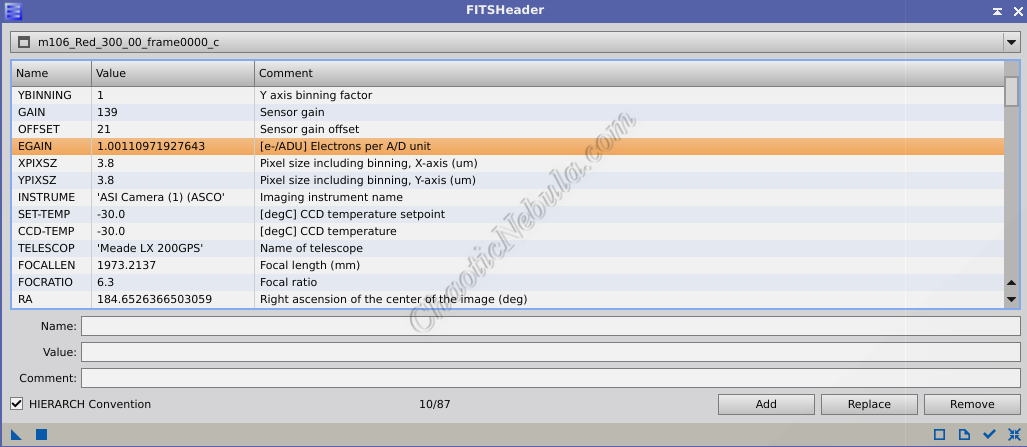
The EGAIN settings identifies the camera gain value in Electrons per A/D unit (e-/ADU).
- Camera Gain: 1.0011
- Data Units: Electrons (e-)
Camera Resolution
The camera resolution determines how many bits are used, per pixel, to determine the brightness level. For example, the ASI 1600MM Cool camera has a CMOS sensor with a bit depth of 12 bits per pixel. This means that each pixel in the sensor can represent a brightness level using 12 bits, allowing for a total of 4096 (2^12) possible intensity levels.
The bit depth needs to be determined for the imaging sensor using the manufacturers website.
Step 2:
Measure Subframes
With the prerequisite information known, the next step within PixInsight Subframe Selector (Process – Image Inspect – Subframe Selector) is to grade each subframe.
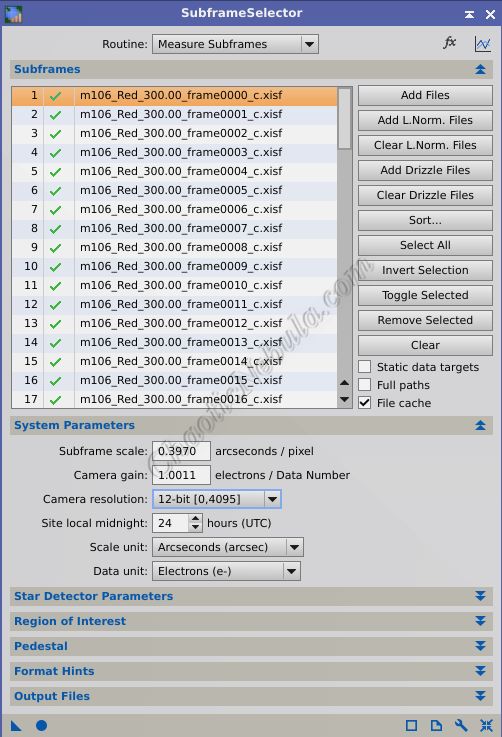
To measure subframes, the subframe process must be configured as follows:
- Routine: Measure Subframes
- Subframes: Add all subframes that have the same characteristics, which includes filter, exposure, sensor temperature, gain, offset.
- System Parameters: All system parameters should have already been identified during the prerequisite steps in this workflow. Although these items aren’t mandatory, they will provide accurate values when evaluating various image quality metrics.
With the settings defined, the process can begin measuring quality of the subframes. Once the measurements are complete, a graph is presented comparing each subframe based on the selected criteria.
Step 3:
Reject Frames
The goal is to remove any subframe that might have experienced issues during imaging. This could be because of tracking issues, a gust of wind, or a passing cloud. These items can be observed within the Subframe Selector measurement graph.
Full Width at Half Maximum (FWHM)
The Full Width at Half Maximum (FWHM) parameter measures the width of the stars in the image at half of their maximum intensity. When stars are out of focus, the width of the stars profile is wider than when stars are in focus. A lower FWHM value indicates a sharper, more focused stars, which means a better quality image.
The first subframe rejection pass is to remove subframes showing high FWHM readings (red X marks rejected frames).
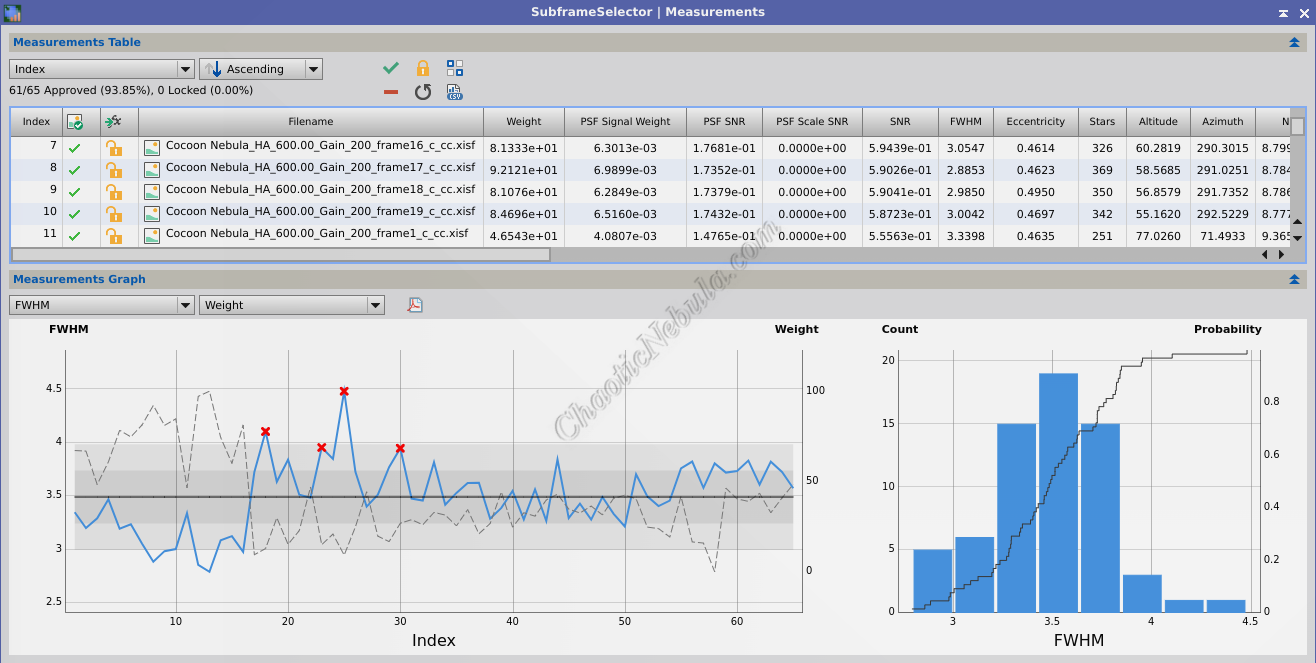
By changing the graph parameter, it is easy to see which subframes show higher FWHM readings. By double-clicking on the image in the list that corresponds to the point in the graph, it is easy to see how the data points relate to poor star quality.
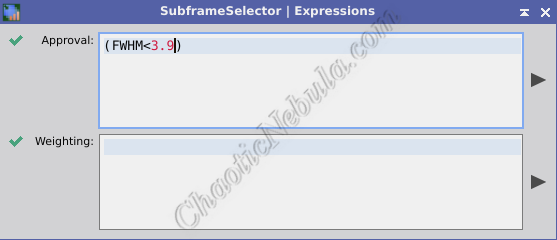
(FWHM<3.9)
To automatically remove the bad subframes, use the Expressions – Approval window and enter in the following formula. Selecting the Arrow button will automatically reject any subframe where the FWHM is not less than 3.9 (this value changes based on the image measurements).
Eccentricity
Eccentricity measures the degree of elongation of stars in the image. Lower eccentricity values indicate rounder, more symmetrical stars. Bad tracking or poor seeing can cause stars to become oblong.
The second subframe rejection pass is to remove subframes showing high eccentricity readings (red X marks rejected frames).
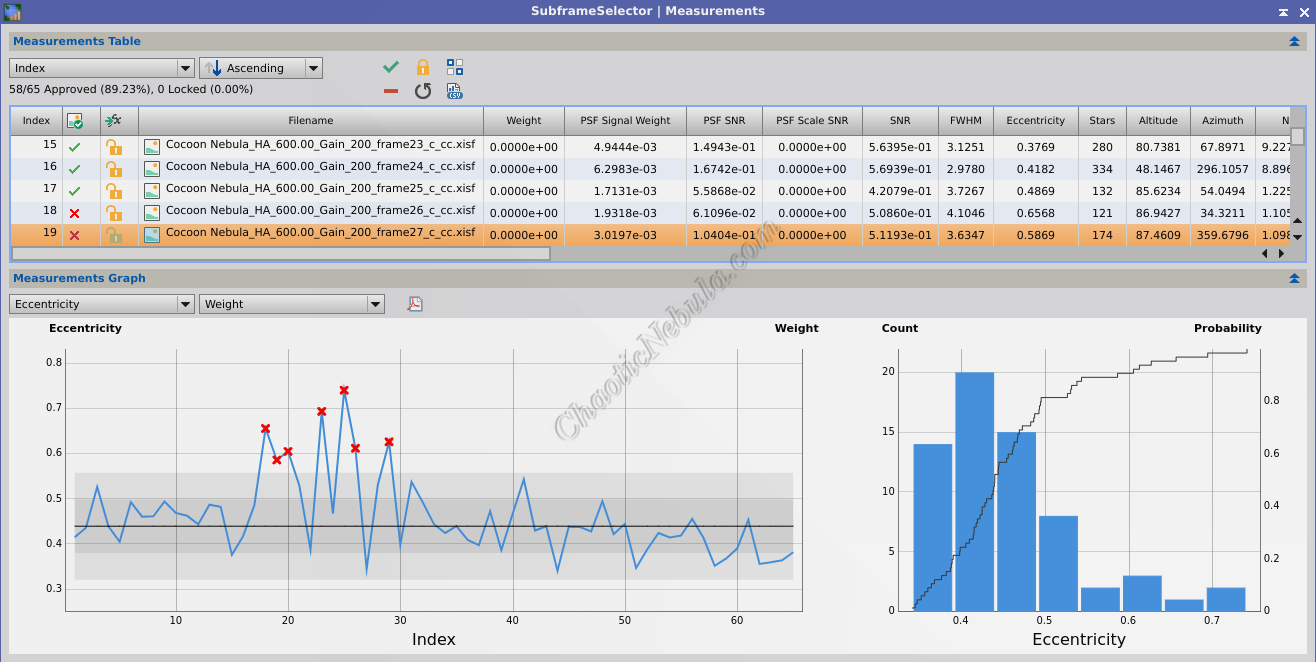
By changing the graph parameter, it is easy to see which subframes show higher eccentricity readings. By double-clicking on the image in the list that corresponds to the point in the graph, it is easy to see how the data points relate to poor star quality.

To automatically remove the bad subframes, use the Expressions – Approval window and enter in the following formula. Selecting the Arrow button will automatically reject any subframe where the eccentricity is not less than 0.575 (this value changes based on the image measurements).
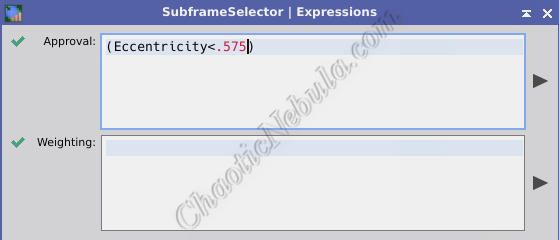
(Eccentricity<0.575)
Step 4:
Identify Best Frames
Identifying the best subframes in PixInsight’s Subframe Selector is essential during later steps within the astrophotography image processing workflow. For example:
- Local Normalization: The local normalization process adjusts the brightness levels of individual regions within an image to enhance local contrast and detail. By applying normalization locally, it helps to reveal subtle features and structures while preserving overall image integrity. This process requires reference images. Subframe Selector helps identifying these images.
- Image Integration: The image integration process of combines the subframes into a single, high-quality image. This process requires a single reference image as a guide. Subframe Selector helps identifying the best image
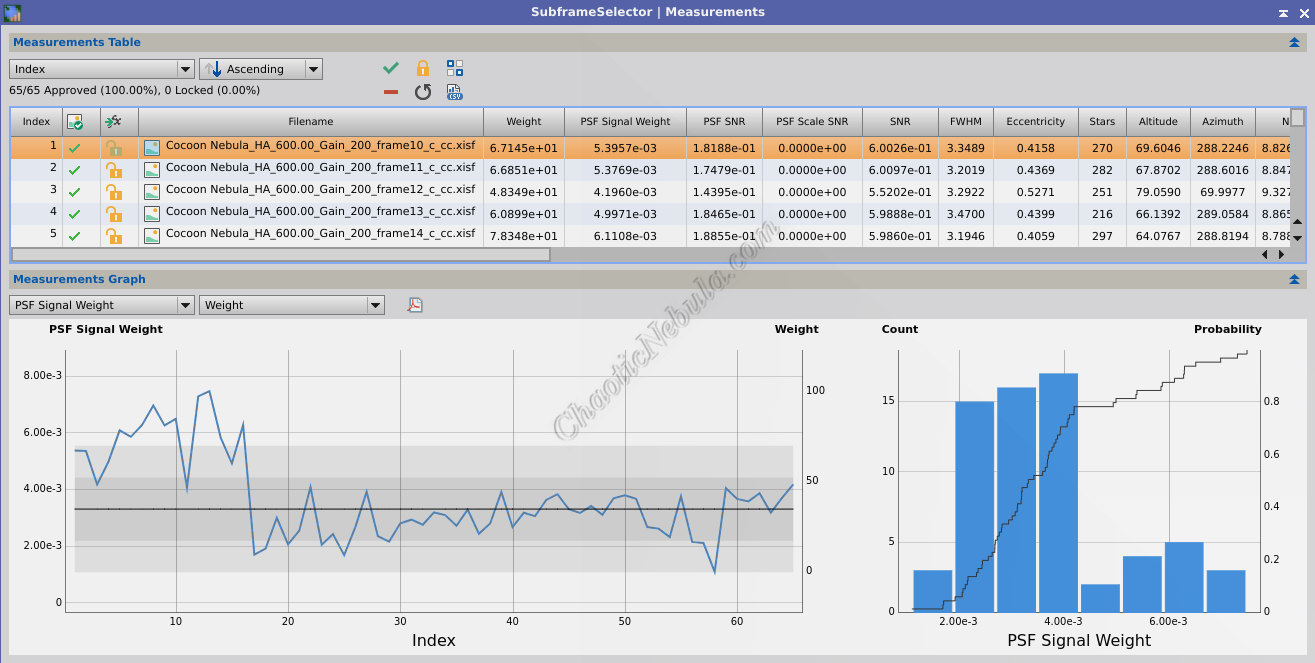
The easiest way to do this is with the PSF Signal Weight parameter. (Best frames marked with circles)
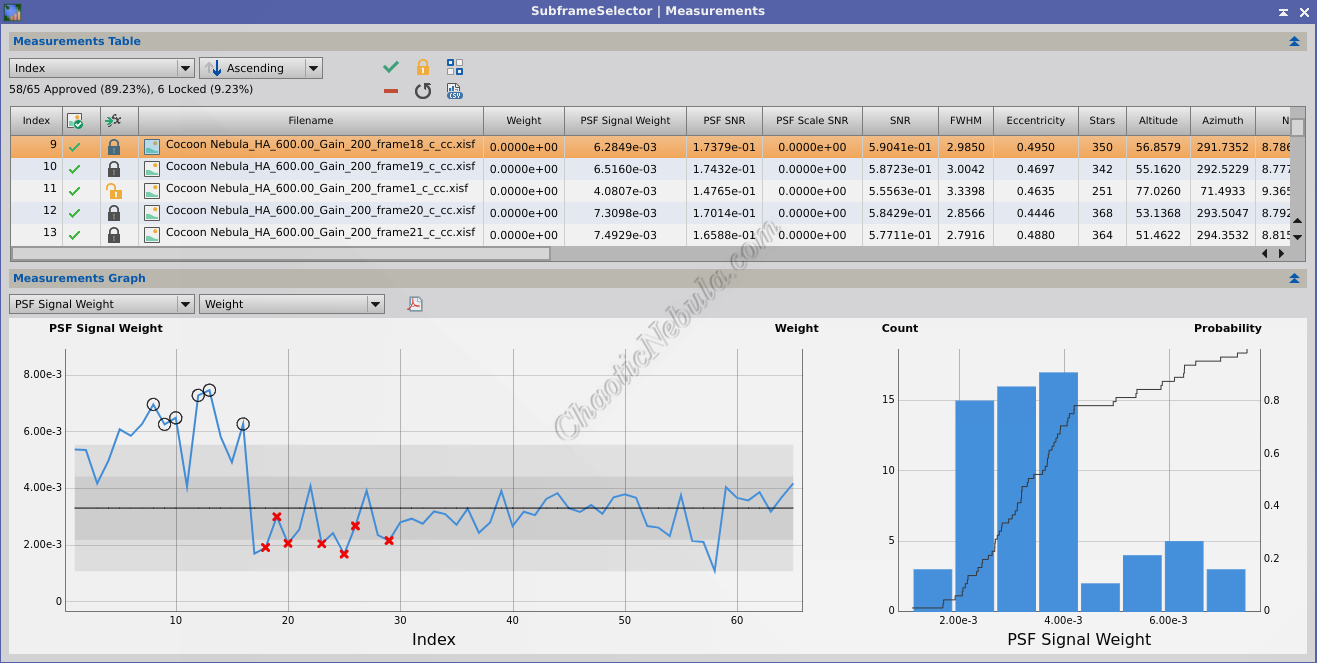
The Point Spread Function (PSF) determines how much blur there is in a star, which should be a point of light. The PSF Signal Weight tells how strong the star’s light is within this blur. A higher weight means the star signal is strong and clear, indicating a sharper image.
By looking at the PSF signal weight for each subframe, it is easy to identify the subframes with the sharpest stars. Identifying the top 5-10% of frames are the ones to use for the Local Normalization and Image Integration processes.


Step 5:
Apply Weights
Even if a subframe isn’t the best quality, it can still contribute value to the final image. Weights corresponding to the quality of each subframe can be calculated and stored in the FITS header to guide the integration process. Subframes with higher weights exert a greater influence on the quality of the final composite image.
The challenge around the subframe weighting is identifying the criteria to use for the weights.
The Subframe Selector calculates a weighted score for each subframe based on the selected parameters and user-defined criteria. This score helps rank subframes and select the best ones for integration. Weighting formulas include a few different components
- Parameters: These are the properties that can be used to generate a weight for each subframe
- PSF Signal Weight (PSFSignal): It quantifies the strength or intensity of the star signal within the Point Spread Function (PSF). A higher PSF signal weights indicate stronger, more well-defined stars in the image, which can be indicative of better focus and image quality
- PSF SNR (PSFSNR): Measures the signal-to-noise ratio within the Point Spread Function of the stars detected in the image. It represents the ratio of the signal (stellar intensity) to the noise (background variations) within the PSF. Higher PSF SNR values indicate cleaner, more well-defined PSFs with less noise contamination, which is desirable for accurate star detection and analysis.
- PSF Flux (PSFFlux): It represents the total flux or intensity of light within the Point Spread Function (PSF) of the celestial object
- Full Width at Half Maximum (FWHM): FWHM measures the width of the stars in the image at half of their maximum intensity. Lower FWHM values indicate sharper, more focused stars.
- Eccentricity (Eccentricity): Eccentricity measures the degree of elongation of stars in the image. Lower eccentricity values indicate rounder, more symmetrical stars.
- Signal-to-Noise Ratio (SNR): SNR measures the ratio of signal (desired information) to noise (unwanted variations) in the image. Higher SNR values indicate better signal quality and less noise.
- Star Count (Stars): Star count measures the number of stars detected in the image. This parameter can provide insights into sky transparency and overall image quality.
- Median Background Value (Median): The median background value represents the average pixel value in the background of the image, away from the stars and other objects. Lower background values indicate cleaner, more evenly illuminated backgrounds.
- Operators
- Min: Adding MIN to the end of a parameter (FWHMMin) selects the minimum value of the parameters from all of the subframes
- Max: Adding MAX to the end of a parameter (FWHMMax) selects the maximum value of the parameters from all of the subframes
- Medium: Adding MEDIAN to the end of a parameter (FWHMMedian) selects the middle value of the parameters from all of the subframes
- Sigma: Adding SIGMA to the end of a parameter (FWHMSigma) provides the number of sigma units from the standard deviation of the median value.
Note: When using weighting formulas that rely on multiple parameters, a pedestal number needs to be added so one subframe results in a weight of 100. Every other subframe will be be less than the best subframe.
Note: To determine the percentage of a parameter, where a higher value indicates better subframe quality, follow this example: ((PSFSignal-PSFSignalMin))/(PSFSignalMax-PSFSignalMin)
Note: To determine the percentage of a parameter, where a lower value indicates better subframe quality, follow this example: (1-(Eccentricity – EccentricityMin)) / (EccentricityMax-EccentricityMin))
Weighting Option 1: Baseline
One of the best and easiest ways to weight subframes is to simply use the PSF Signal Weight. The Point Spread Function (PSF) is a solid approach for determining the best subframes. If using PSF Signal Weight, simply move onto the next step in the Subframe Process.
Weighting Option 2: Galaxies
Using a weight based on the sharpness of stars might be challenging with dealing with galaxy images if they lack a well populated star field. The following formula leverages the signal-to-noise ratio to influence the subframes weight.
- FWHM: 20%
- Eccentricity: 15%
- SNR: 25%
- Pedestal: 40% – This number needs to be modified so the best subframe has a weight of 100.
(20*(1-(FWHM-FWHMMin))/(FWHMMax-FWHMMin)) + (15*(1-(Eccentricity - EccentricityMin)) / (EccentricityMax-EccentricityMin)) + (25*((SNR - SNRMin) / (SNRMax-SNRMin))) + 40
Weighting Option 3: Nebula
Nebula are more difficult to grade as the nebulosity can cause stars to become bloated, throwing off the values for FWHM.
- FWHM: 5%
- Eccentricity: 10%
- SNR: 20%
- Pedestal: 65% – This number needs to be modified so the best subframe has a weight of 100.
(5*(1-(FWHM-FWHMMin))/(FWHMMax-FWHMMin)) + (10*(1-(Eccentricity - EccentricityMin)) / (EccentricityMax-EccentricityMin)) + (20*((SNR - SNRMin) / (SNRMax-SNRMin))) + 65
Weighting Option 4: Clusters
Clusters are easier to grade as they are almost 100% based on star profiles. FWHM and Eccentricity are some of the best parameters to use as they help define the stellar profile.
- FWHM: 35%
- Eccentricity: 35%
- SNR: 20%
- Pedestal: 10% – This number needs to be modified so the best subframe has a weight of 100.
(35*(1-(FWHM-FWHMMin))/(FWHMMax-FWHMMin)) + (35*(1-(Eccentricity - EccentricityMin)) / (EccentricityMax-EccentricityMin)) + (20*((SNR - SNRMin) / (SNRMax-SNRMin))) + 10
Weighting Option 5: Stellar Intensity
The following example uses PSF Flux, which looks at the intensity of the PSF signal as well as the sharpness and roundness of stars using FWHM and Eccentricity respectively.
- FWHM: 20%
- Eccentricity: 20%
- SNR: 20%
- Pedestal: 40% – This number needs to be modified so the best subframe has a weight of 100.
(20*(1-(FWHM-FWHMMin)/(FWHMMax-FWHMMin))) + (20*(1-(Eccentricity-EccentricityMin)/(EccentricityMax-EccentricityMin))) + (20*(PSFFlux-PSFFluxMin)/(PSFFluxMax-PSFFluxMin))+40
Step 6:
Output Weighted Subframes
Once the subframe weighting formula is defined, the weights can be added to the subframes and saved as new files.
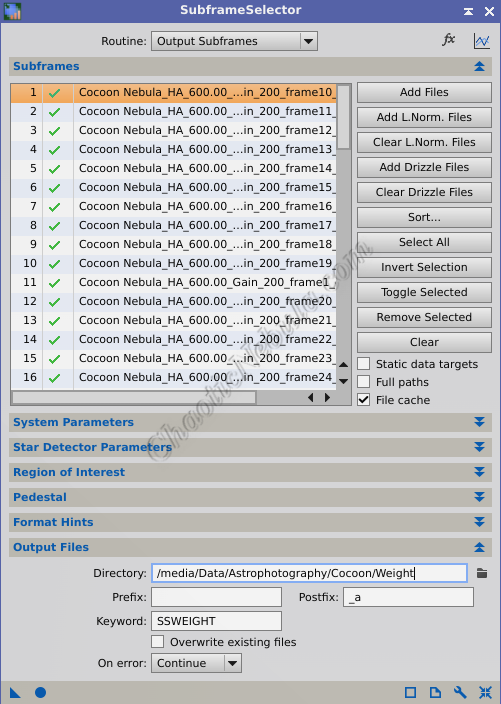
To output the subframes, configure the following:
- Routine: Output Subframes
- Directory: Specify the directory for the new files
- Keyword: The weights for the subframe will get stored in the FITS header of each file under the specified keyword. This keyword is then used during Image Integration.
Note: If PSF Signal Weight or PSF SNR are used as the only weighting parameter, no keyword is required.
What’s Next
With the subframes graded and weighted, the image processing can continue based on the respective workflow: